Showing posts with label Stats. Show all posts

Wednesday, October 19, 2016

2016 NLCS - Metropolis vs. Fleetwood - Series Preview

The Fleetwood Walkers and Metropolis Avengers have been the class of the National League for several years and they seemed destined to meet in the NLCS again in 2016. Before the fireworks start, let's look at some of the stats and stories that may (or may not) be key to who goes to the World Series and who goes home.

  • The teams have met in the playoffs four times and Fleetwood is certainly looking to change the result:
    • 2015 NLCS (Metropolis in five)
    • 2013 NLCS (Metropolis in seven)
    • 2012 NLDS (Metropolis in seven)
    • 2006 NLCS (Metropolis in seven)
  • In the last five years, Fleetwood has averaged 111.2 wins per year. Metropolis has averaged 114.2.
  • However, this year Fleetwood topped the Avengers 121 wins to 116. 
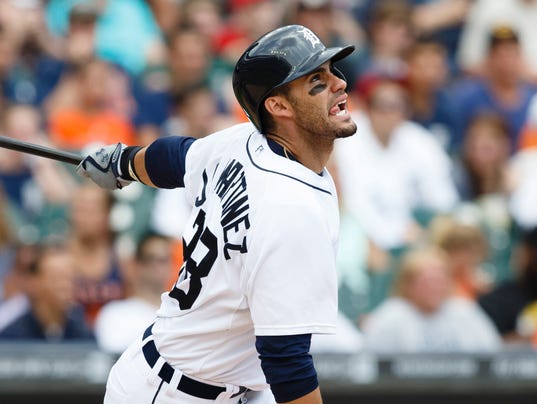
  • Each of the teams has a young superstar who thinks they should be the MVP. Fleetwood's Mike Trout is the defending MVP and hit .276/.362/.499 while playing sterling defense in the outfield. Metropolis's Bryce Harper is looking to take the trophy this year and put up a .304/.425/.655 season.
  • Both clubs also have slugging veterans to protect their young stars. Walker Miguel Cabrera and Avenger David Ortiz put up nearly identical OPSs of 1.061 and 1.051 on the season.
  • The Walkers clubbed left-handed pitchers during the season. They were 44-9 against LH starting pitchers and had an .894 OPS against them. The Avengers, however, will start only righties in the series and their lefties are far from typical - Aroldis Chapman and Zach Britton combined for a 1.53 and 102 strikeouts in 82 1/3 innings.
  • Collin McHugh had a great start for Metropolis in the NLDS, but rumor is the team is considering moving Nate Karns into the rotation for the NLCS. Karns has a hard fastball/sinker combination which may be a better matchup against the slugging Walkers.
  • Metropolis may have an advantage on defense. The Avengers committed 71 errors which led to 56 unearned runs. The Walkers booted 89 errors, but they actually allowed fewer unearned runs (45).
  • One area Fleetwood has the advantage is its bench. The Avengers had just 92 pinch hitting opportunities during the season and they managed just a .174 average. The Walkers hit .291 in their 165 pinch hitting chances.
  • You should probably bet the under on the number of intentional walks in the series. Fleetwood gave three free passes during the season. That was three more than Metropolis gave.
  • Fleetwood hitter came through in the clutch - with an .843 OPS and three grand slams with the bases loaded. The Avengers, however, were even better. They had a 1.118 OPS and 12 homers in just 131 at bats with the bases loaded. 
  • Metropolis better think twice before running on Kevin Kiermaier. The Fleetwood center fielder was among the league leaders with ten outfield assists. 
  • The Walkers were also the runners, at least compared with Metropolis. Fleetwood stole 83 bases and was thrown out just 17 times. Metropolis stole on 40 bases with 18 caught stealing.
  • The Avengers have used dominant bullpens as key cogs in their four consecutive NL champion clubs. They still have some big names, but this year their relievers had a good, but not great, 3.22 ERA. In fact, the Walker bullpen was much better during the season and compiled a 2.57 ERA.
  • Fleetwood won five of the seven matchups between the two teams. They outscored Metropolis 52-30 in the series.
  • Andrew McCutchen and Bryce Harper formed Brassball's best 1-2 punch. Harper led the league with 132 runs scored and McCutchen finished just behind with 127.
  • Metropolis also had the 1-2-3 sluggers in the National League. Harper led the league with 48 homers, David Ortiz was second with 44 and Chris Davis was third with 43.
  • Robinson Cano has been a star for Metropolis for years, but he's been moved way down the order this year. The Avengers had good reason, as their second baseman grounded into 29 double plays on the season.
  • Fleetwood's Zack Greinke led all pitchers with 23 wins. He also finished second with an .828 winning percentage. His teammate John Lackey finished first at .833.
  • Another Walker starter, Garrett Richards, also led the league in something. His 25 wild pitches were ten more than anyone else in the league.
  • Metropolis's Hall of Justice is the most pitcher-friendly park in Brassball, but Avenger batters were second in the league with a .836 OPS. Fleetwood was third at .820.

Pennant Race Trades Reviewed

The Avengers have represented the National League in the Brassball World Series for the last four years. In each of those years, the club's front office has been aggressive at the trade deadline, being willing to trade draft picks and prospects for players who could help them play for and win a title. Let's take a look at those trades and how they worked out.

2012
1. $100,000 to Florence for David Herndon.
This was a smaller trade, and Herndon got only limited work in the playoffs. He was supposed to lock-down opposing right-handed hitters, but he gave up six hits in 3 1/3 innings and had a 10.80 ERA.
Grade: D

2. Jed Lowrie to Parkland for Kenley Jansen.
Lowrie was a good, but not great, infielder and the Avengers traded him for a shut-down reliever. Jansen was a weapon for three Avenger playoff rosters and helped them win two World Series rings. He totaled 47 2/3 IP with a 2.27 ERA in the 2012, 2013, and 2014 playoffs.
Grade: A-

3. David Carpenter to Boston for Jeremy Affeldt
Affeldt was a LOOGY and did his job well. He pitched just 6 2/3 innings, but didn't allow an earned run and picked up one win along the way.
Grade: B

4. Miguel Sano, Anthony Rendon, Matt Adams, Chris Resop, 2013 #1 draft pick to Butte County for RA Dickey and Craig Kimbrel
Wow. This was the blockbuster. The Avengers gave up a ton of future value, but got two stars in return. Dickey went 5-1 in the 2013 postseason with a 3.89 ERA in seven starts and 39 2/3 IP. Metropolis expected Kimbrel to be nothing short of unhittable and he delivered the goods. He's pitched in 37 playoff games and totaled 61 2/3 innings while allowing a minuscule 0.29 ERA. He struck out 79 batters and allowed just 28 hits and 27 walks. Metropolis leveraged Kimbrel to the extreme and it worked better than anyone could have expected.
Grade: A- (docked for the tremendous value traded away)

2013
1. Carter Capps, Rubby de la Rosa, Adalberto Mondesi, Corey Seager, Zach Stewart, 2014 #2 draft pick to Springfield for Kris Medlen
Another blockbuster. The Avengers traded away four top prospects for Medlen, who they expected to be their ace for the next couple years. Medlen was certainly their ace in the playoffs. He started four games in 2013 and pitched 29 1/3 innings with a 1.53 ERA. He went just 1-1 in those starts, but it's hard to blame him. That said, the team failed to defend their championship that year and then Medlen got hurt. The World Series loss and injury knock this grade down quite a bit, and that's before considering all the talent traded away.
Grade: C

2. $50,000 to Springfield for Randy Choate
The quintessential aging lefty, Choate got into just one game for the Avengers that October. He pitched one inning and gave up an earned run on two hits.
Grade: C

3. $600,000 to West Hills for Carlos Ruiz
Ruiz stepped right in as the starter and hit near the top of the order. In 17 games and 72 at bats, Ruiz hit .293/.329/.520 while tying for the team lead with four homers. You can't ask for much more than that, particularly when the cost was just $600,000.
Grade: A

2014
1. #8 draft pick to Latrobe for Nick Vincent
Vincent was asked to retire tough right-handed hitters and he did just that. He appeared in seven games and pitched 9 2/3 innings with a 1.86 ERA. He wasn't the most critical pitcher in the bullpen, but he got the job done when called on.
Grade: B

2. Jesus Guzman and $125,000 to Sacramento for Josh Satin
Satin was added to serve as the right-handed part of a first base platoon with Chris Davis. He didn't do much, hitting just .176/.263/.412 in the postseason.
Grade: F

3. Mike Fiers, Freddy Garcia, Michael Blazek, $500,000, and Bonus Pick to Tinley for Justin Masterson
Masterson was a late addition to an already strong rotation. He was only called on to start one game in each series, but he won all three games he started and put up a solid 3.44 ERA.
Grade: A-

4. Andrew Romine, Luis Jimenz, $250,000 to West Hills for Ramiro Pena.
Pena was acquired to be a pinch hitter off the bench. He appeared in just one game and went 0-1, but he did get a World Series ring.
Grade: D

2015
1. Kenta Maeda, Amed Rosario, Corey Knebel, Timberlake #3 draft pick for Anibal Sanchez, Ronald Belisario, $5,750,000 
Sanchez did what was asked of him - he was a good fourth starter. He only won a single game, but gave the Avengers a 2.87 ERA in his three starts. Metropolis gave up a lot of value to get those 15 innings, and that has to affect the trade's grade. Kenta Maeda is exactly the type of player the Avengers could use, and now he's on a league rival.
Grade: C

2. Freddy Galvis and Franklin Barreto to Sacramento for Steve Pearce
Pearce came in to play 1B against righties, but he forgot to bring his bat with him to Metropolis. Pearce hit just .210/.279/.306 with a one homer and two runs batted in. The Avengers likely would have been better letting Jose Bautista play every day. They couldn't have been worse.
Grade: D

Flags Fly Forever
It's hard to argue with four World Series appearances and two titles, but the Avengers have traded away enough talent to form the core of another playoff team. In fact, you can build most of a good lineup with the players dealt away:

1B - Matt Adams
2B - Jed Lowrie
3B - Anthony Rendon
SS - Corey Seager
LF - Miguel Sano

While that club may be missing a few positions, it can fill in with talented young shortsops Raul Mondesi, Amed Rosario, and Franklin Barreto.

The Avengers also traded away pitchers Kenta Maeda, Rubby De La Rosa, Carter Capps, Michael Blazek, and Corey Knebel, so they paid the price on both sides of the ball.

Of course, trading away players like that brings a lot in return. Most of the Avenger trades were for pitching, and the pitchers acquired in the trades above were instrumental in the club's postseason success. When combined, those pitchers put up a line that looks like this:
101 Games
17 Games Started
232 2/3 Innings Pitched
2.13 ERA
21 Wins
6 Losses
13 Saves
154 Hits
247 Strikeouts
94 Walks

Losing players like Seager, Rendon, Sano, and Maeda hurts, but doing so helped Metropolis win two World Series titles, and they're still looking for more. That's a trade (or trades, to be accurate) the team would make every time.

Sunday, October 16, 2016

2016 NLDS - Metropolis vs. Sacramento - Series Wrap-Up


The Metropolis Avengers dropped the first game of their NLDS matchup with the Sacramento Senators, but they won the next four games to advance to the NLCS for the fifth-straight year. Anyone watching the series would likely summarize it by saying "Metropolis pitching dominated," but there are always some interesting statistics hiding if you look a bit deeper. Here are a few of them.
  • Sacramento won Game One 5-3, but only scored four runs the rest of the series. 
  • The Senators scored a single run in the final three games of the series.
  • Third baseman Danny Valencia was a bit overlooked during the season, as his 18 homers were just seventh on the club. He came up big in the NLDS, though, leading the way with two homers and six RBIs.
  • Metropolis traded for Zach Britton at the deadline and he paid off in the NLDS. He pitched 6 1/3 innings in four games and allowed just two hits while striking out eight batters without a walk.
  • Metropolis used just two pinch hitters all series and neither Pablo Sandoval nor Dioner Navarro came through in their chances.
  • Sacramento's pinch hitters had even more trouble - Chris Carter was 0-4 in his pinch-hitting opportunities and Colby Rasmus and Kelby Tomlinson each went hitless in a single at bat.
  • Pitching was the story of the series. Avenger pitchers allowed just 24 hits and struck out 47 batters. Senator pitchers gave up 38 hits and struck out 42 Avenger batters.
  • Metropolis batters combined for a .321 OBP and .379 SLG, which combined for an even .700 OPS in 187 plate appearances Sacramento batters struggled with a .205 OBP and .218 SLG. That added up for a .423 OPS across 166 plate appearances.
  • Kevin Pillar homered in the bottom of the seventh in Game One. It was the last homer Sacramento would hit in 2016.
  • Prince Fielder had a rough series. It wasn't just his.255 OPS - he also grounded three double plays in the five games.
  • Former Avenger Freddy Galvis did his best to send his former team home. He hit .294 in the series, second only to Jason Kipnis. He also played a perfect shortstop and also scored and drove in two runs.
  • Metropolis starting pitchers combined for a 1.57 ERA, but averaged fewer than six innings per start.
  • Despite the great pitching and low scores, neither team showed much interest in playing small ball. They combined for just one stolen base (by Kipnis) and zero sacrifice bunts.
  • Carlos Martinez came up short in Game Five, but he looks like an ace for many years to come. He struck out 17 batters and allowed just ten hits in 13 1/3 innings.
  • Andrew McCutchen was steller in the lead-off role for the Avengers. He hit .389/.522/.722 in the series for a .1.244 OPS.
  • Unfortunately for the Avengers, Bryce Harper followed McCutchen in the order and hit just .158 without an extra base hit. It will be difficult for Metropolis to advance to the World Series unless Harper breaks out of his slump.
  • Avenger righty Joaquin Benoit had a 1.47 ERA in 61 1/3 innings during the season. Metropolis claims he's fully healthy, but he didn't make an appearance against Sacramento. 

Tuesday, October 11, 2016

2016 NLDS Preview - Metropolis vs. Sacramento


The Metropolis Avengers begin their defense of the NL crown in a National League Division Series matchup with the Sacramento Senators. 
  • The Avengers won 6 of their 8 matchups with the Senators during the regular season.
  • In those wins, the Avengers averaged 12.33 runs a game!
  • Sacramento traded for Kevin Pillar and Desmond Jennings at the trade deadline. Pillar hit .307/.322/.464 after the trade. Jennings hit a robust .429/.429/.714, but it was in only a handful of at bats.
  • Metropolis traded for Zach Britton, Jose Iglesias, and Dioner Navarro to round out its playoff roster.
  • Britton put in heavy work, pitching 26 innings in just 16 games, with a 1.73 ERA. Iglesias was a revelation at shortstop, hitting .362/.397/.424 for the Avengers.
  • Metropolis scored 936 runs and allowed just 605, for a 331-run differential on the season. 
  • Sacramento scored 851 runs and allowed 720, for a 131-run differential.
  • The Senators collected 45 saves on the year but had 20 blown saves. Mark Melancon had 35 of those saves and four of the blown saves.
  • The Avengers recorded 57 saves, but they were spread around 11 different pitchers, with Craig Kimbrel leading the team with just 13. The team blew 25 saves on the year.
  • Sacramento committed 67 errors on the season and gave up 44 unearned runs.
  • Metropolis committed 71 errors and allowed an identical 44 unearned runs.
  • The Senators slugged 190 homeruns, but finished far behind the Avengers, who hit 277.
  • However, Sacramento had a much higher team batting average than did Metropolis - .284 to .267.
  • Metropolis will start a right-handed pitcher in each game, which is just fine with Sacramento. The Senators slugged .466 against righties but just .375 against lefties.


Thursday, November 12, 2015

2015 World Series - Metropolis at Santa Barbara - Game Two

Santa Barbara takes a 1-0 series lead into Game Two with the visiting Metropolis Avengers. The Avengers have Corey Kluber on the mound in their effort to tie the series. Outlaw Alex Cobb takes the ball for his club, who hoping to put Metropolis in an 0-2 hole.

Denard Span ripped a leadoff double and scored the first run.
Cobb took care of the Avengers in the first and the Outlaw hitters got right to work in the bottom of the inning. Leadoff hitter Denard Span lashed a double down the line to start the inning and speedy 2B Jose Altuve followed with a single. Surprisingly, Span took the conservative route and did not challenge Andrew McCutchen's throwing arm by trying to score. That put runners on the corners for Jason Heyward. The lefty hit a sharp ground ball for a fielder's choice, but it was enough for Span to score the game's first run. Buster Posey then followed with another ground ball, moving Heyward into scoring position. JD Martinez came through with a clutch two-out single, scoring Heyward and putting Santa Barbara up 2-0. Much like Game One, when they scored three runs in the first, the Outlaws jumped on the Metropolis starter early and put the visitors on their heels.

JD Martinez's single put the Outlaws up 2-0.
The Avengers tried to rally in the second, but did so in an unusual way - they put three runners on base without the benefit of a hit. Jose Bautista and Jose Reyes both walked and Michael McKenry reached on an error by 1B Edgar Encarnacion. However, Pablo Sandoval grounded into a double play to erase Bautista and Jayson Werth failed to deliver a key hit with two on and two out and the game stayed 2-0 Santa Barbara.

Santa Barbara tacked on a run in the bottom of the fourth with some aggressive baserunning. Carlos Santana drew a walk with two outs. Elvis Adrus followed with a double and Santana surprised many by getting an excellent jump and sprinting all the way around to score just ahead of McCutchen's throw. The Outlaws have long been known for taking chances on the bases, and Santana must have been taking notes from the team's speedsters. His dash around the bases gave Santa Barbara a 3-0 lead.

Metropolis began another unusual rally in the top of the fifth inning. Werth started the inning with a walk and moved to second on a passed ball. Andrew McCutchen then hit a grounder to first, but Encarnacion booted it for his second error of the game and the Avengers had runners on the corners. Robinson Cano had a chance to do some damage and hit the ball hard, but he didn't get quite enough and it turned into a long sacrifice fly to put Metropolis on the board and trim the lead to 3-1.

The Avengers used another lead-off walk in the top of the sixth to scrape together their second run. Jose Bautista drew the base on balls and moved to third on Pablo Sandoval's sharp single to right. Michael McKenry came to bat, but grounded into a double play. Bautista did score on the play to cut the lead to one, but it also put the brakes on a budding rally.

Wieters tied the game with a clutch pinch hit.
Outlaw Buddy Carlyle took over for Cobb in the top of the seventh inning. He struck out Werth for the first out, but then dug himself a hole by walking McCutchen and Cano and bringing Steve Pearce to the plate. Carlyle jammed him with a fastball, which Pearce lifted into center field for an easy out. Santa Barbara then brought in Jonathan Papelbon to face DH Melky Cabrera, but Matt Wieters came out of the Avengers dugout instead. Wieters came through in the clutch and ripped a hard single past the infield and sent McCutchen home with the tying run.

Metropolis manufactured three runs to tie the game and looked to take the lead in the eighth with a two-out rally. Jose Reyes doubled and Werth walked, bringing McCutchen, the best Avenger hitter, to the plate. McCutchen was the MVP of the NLCS, but failed in this spot, as he swung through a Papelbon fastball and struck out to strand both runners.

Avenger reliever Joaquin Benoit had entered in the sixth and kept the Outlaws off the board through the seventh and eighth innings. Santa Barbara's best reliever, Andrew Miller, was in the game and matched zeroes, keeping the game tied at three as it moved to extra innings.

Cano's homer gave Metropolis its first lead.
Werth drew his third walk of the game to lead off the eleventh. He was the potential go-ahead run and moved up 90 feet when McCutchen hit an infield single perfectly placed between second and third. Santa Barbara closer Ken Giles came on to face Cano with two runners on and no outs. Cano worked the count to 2-2 and Giles left a fastball over the middle of the plate. The Avenger second baseman didn't miss his pitch and he drove it into the right field stands for a homer and a 6-3 Metropolis lead.

Craig Kimbrel had entered with two outs in the bottom of the ninth, but stayed in the game for the eleventh. He got two quick ground outs from Encarnacion and Arenado before walking Santana to keep the Outlaws alive. Pinch hitter Delmon Young came to bat for Elvis Andrus, but Kimbrel finished him off with three fastballs in the mid-90s to end the game.

Metropolis has to feel good after fighting back from a three-run deficit to win the game and even the series at one game each. The series now moves to Metropolis for Games Three, Four, and Five. Given the history these teams have with each other and in the postseason, it's hard to imagine the series does not return to Santa Barbara. 

Monday, November 9, 2015

2015 World Series Preview - Metropolis vs. Santa Barbara


The American League Champion Santa Barbara Outlaws are set to meet the National League Champion Metropolis Avengers in the World Series for the third time in four years. Metropolis won the 2012 series in seven games and Santa Barbara won the 2013 series in six games. While the only numbers that matter from now on are wins and losses, there are others that help set the stage for the Fall Classic:

  • Santa Barbara won 108 games on the season and Metropolis won 106.
  • The Outlaws got the best of the Avengers during the season, winning four of the seven games between the teams. Santa Barbara outscored Metropolis 31-23 in those seven games.
  • During the season, Metropolis outscored its opponents 794-510, for a +284 run differential. Santa Barbara outscored its opponents 795-576 for a +219 run differential.
  • Baseball's version of the Pythagorean Formula projects the Avengers to win 110 games and the Outlaws 104.
  • The Outlaws and Avengers have dominated their respective leagues for the last few years. The Outlaws are in their fourth World Series in the last five and Metropolis is appearing in its fourth straight.
  • Metropolis also won the National League in 2006, when it won its first World Series.
  • The teams were nearly identical on offense. Metropolis hit .275/.339/.419 for a .758 team OPS. Santa Barbara hit .276/.335/.422 for a .757 team OPS. Despite the eerily similar numbers, Metropolis may have the better offense, as they play half their games in the spacious Hall of Justice.
  • However, that same large ballpark may mean the Avengers’ pitchers don’t have the advantage their raw numbers may suggest. Metropolis’s pitchers compiled a 2.91 ERA with 1480 strikeouts and 120 home runs allowed during the season. Santa Barbara pitchers teamed up for a 3.23 ERA with 1324 strikeouts and 158 home runs.
  • Looking at home runs hit at home and on the road is one way to demonstrate how much the Hall of Justice can depress offense. The Avengers hit 86 big flies on the road but just 60 at home. The Outlaws home runs were evenly distributed, with 73 on the road and 72 at home.
  • The Outlaw bullpen may be even better than the Avengers’. Santa Barbara had a 2.33 ERA in relief and allowed just 27 homers in 437 innings.
  • Metropolis’s relievers were also excellent, but had a higher ERA at 2.80. They also allowed more homers – 34 in 462 innings.
  • If it comes to a game of small-ball, the Outlaws will likely win the series easily. They had 70 sacrifice bunts and the Avengers had none. (That’s not a typo – they didn’t have a successful bunt all season.) Santa Barbara’s 10 squeeze attempts were the most in baseball.
  • Santa Barbara also stole nearly ten times as many bases as Metropolis – 267 to 28.
  • Metropolis has a five day layoff between the NLCS and the World Series, as they only needed five games to dispatch the Fleetwood Walkers.
  • The ALCS went the full distance, giving Santa Barbara just three days to rest before the World Series. That may force Santa Barbara to shuffle its rotation for the World Series and the team has yet to announce its Game One starter.
  • The Avengers rotation is rested and ready. It will likely begin just as it did the NLDS and NLCS, with Carlos Carrasco and Corey Kluber getting the starts at Santa Barbara in Games One and Two. The big question for Metropolis is if Collin McHugh is still in the rotation after his disastrous NLCS start. If he gets bumped, the Avengers could turn to either Stephen Strasburg or Yusmeiro Petit in his spot.
  • Santa Barbara changed their rotation for the ALCS, bumping long-time Oultaw Jered Weaver in favor of lefty Madison Bumgarner. It’s unclear who will get the spot in the World Series, but Bumgarner seems to have the inside track.
  • Bumgarner was 15-12 with a 4.32 ERA on the season. Weaver went 14-11 with a 4.27 ERA. Both took the ball every time and started 35 games.
  • Outlaw lefty reliever Andrew Miller may well be the deciding factor in the series. He was nearly untouchable during the season, with a 1.15 ERA in 62 2/3 innings. He allowed just 27 hits and 12 walks while striking out 101.
  • However, Avenger ace Carrasco could shut down the Outlaws in the two games he’ll start. He was 15-4 in his 23 starts and had a 1.86 ERA in 140 1/3 innings. Carrasco allowed only 83 hits and 28 walks in those starts. Even more impressive were the five total homers he allowed, a rate of less than one every nine innings.
  • The Outlaws likely have the best table setters in Brassball. Denard Span and Jose Altuve combined to hit .329 with 152 stolen bases and 197 runs during the season.
  • Santa Barbara added relievers Jonathan Papelbon and Sean Doolittle during the season. Papelbon put up a 3.43 ERA in his 32 games as an Outlaw. Doolittle had a 3.57 ERA in just 14 games after the trade.
  • The Outlaws also added OF/DH Delmon Young in a trade. Young apparently liked the new surroundings, as he hit .313/.371/.531 for a .903 OPS with Santa Barbara.
  • No matter what happens in the series, both teams will be among those most likely to return in 2016. One big difference is that Santa Barbara is sitting on a pile of cash to spend in free agency while Metropolis appears to be up against its payroll cap and likely has limited flexibility to fill holes in the off-season.

Saturday, November 7, 2015

2015 NLCS Recap - Metropolis at Fleetwood


The Metropolis Avengers defeated their long-time NL rival Fleetwood Walkers to win the National League Championship Series and the right to represent the league in the Brassball World Series. The two teams have a long history of memorable playoff battles, but this series wasn't one of them. Metropolis won in five games, while most of their previous matchups have gone the distance.

Although stats alone can't tell the real story of any baseball game or series, they can generally shed some light on the match up. Here are some of the more interesting nuggets from the 2015 NLCS:
  • 2015 was the third NLCS matchup between the Metropolis Avengers and Fleetwood Walkers. They also met in 2006 and 2013. Metropolis won both those series in seven games.
  • Despite losing four of five games, Fleetwood actually outscored Metropolis 19-17. Of course, their lone win was an 11-3 blowout while they lost two games in extra innings, both by a single run.
  • Avenger CF and leadoff hitter Andrew McCutchen won the NLCS MVP. He seemed to be on base all the time and set the table for number two hitter Robinson Cano. McCutchen hit .278/.480/.500 for a .980 OPS. He collected seven walks and scored five times in the series.
  • Both offenses were pretty bad. Or maybe both pitching staffs were really good. Fleetwood batted .236/.312/.346 for a .658 OPS. The Avengers tallied a .194/.292/.329 line for a .622 OPS.
  • During the regular season, Fleetwood went .276/.346/.430 for a .776 OPS. Metropolis hit .275/.343/.419 for a .762 OPS.
  • In their last playoff matchup, the 2013 NLCS, Metropolis got the better of Walker stars Mike Trout and Miguel Cabrera. They held Trout to a .222/.276/.333 line and Cabrera was even worse: .167/.252/.292. Both players were better in 2015, but still not as good as expected. The pair collected just four RBIs in the five games and hit a combined .250/.333./350 for a .683 OPS. They didn’t hit a single homer and struck out 12 times.
  • Trout hit second in the Fleetwood lineup and Cabrera hit cleanup. The team's leadoff and number three hitters didn’t do much to help them out. Seth Smith hit leadoff in four of the five games and Kevin Kiermaier hit third in all five. They combined to go just 4-35 with one extra base hit and just one run batted in.
  • Metropolis had its own cold hitters. Pablo Sandoval, Bryce Harper, and Chris Iannetta had for only three hits in 49 at bats and combined for a brutal .062/.098/.122 line and a .220 OPS.
  • Given the depth of Harper’s struggles, it is possible the youngster is simply worn out after a long season. Veteran Melky Cabrera got just two at bats in the NLCS, but may receive more in the World Series.
  • Lefty flamethrower Aroldis Chapman appeared in only one game, despite striking out 91 batters in just 56 2/3 IP during the regular season.
  • Walker reliever Tom Wilhelmsen will need some rest and recuperation after the series. He pitched in four of the five games for a total of 11 2/3 IP. He went 0-1 with a 2.31 in those appearances. Wilhelmsen pitched more innings than even Hisashi Iwakuma, who started two games and tossed 11 innings.
  • Avenger righty Joaquin Benoit also appeared in four games, but for a less onerous 7 1/3 innings.
  • Metropolis starting pitchers combined for a 5.01 ERA. Most of that damage was Collin McHugh’s disastrous Game Three start, when he gave up nine earned runs in 2 2/3 innings. Carlos Carrasco, Corey Kluber, and Anibal Sanchez combined for a 1.74 ERA in their four starts.
  • Fleetwood’s starters had a 2.81 ERA in the series. Daisuke Matsuzaka had their worst start, allowing four runs in 4 1/3 innings, mostly due to the five walks he allowed. In addition to Dice-K’s walks, the Walker starters were victimized by the long ball. They allowed five homers in just 27 innings.
  • Fleetwood only hit one homer in the entire series – Francisco Cervelli’s shocking pinch-hit blast off Joaquin Benoit in Game Two. Benoit allowed just three homers all season and Cervelli only hit three himself.
  • The Avengers hit six home runs. Three were back-to-back-to-back, but those were in the one game the team lost.
  • Surprisingly, Fleetwood was much better in the clutch. They had 26 clutch at bats and hit .308/.400/.423 for a .823 OPS. Metropolis had half as many chances and hit just .231/.286/.308 for a .594 OPS. Fleetwood collected 11 RBIs in their chances and Metropolis drove in just three runners in clutch situations.
  • Metropolis 1B Jose Bautista booted two groundballs in the series. He may move to the outfield if Metropolis shakes up their lineup in the World Series. That would allow him to show off his strong throwing arm while also moving Steve Pearce to 1B.
  • Fleetwood returns most of its lineup for 2016, but will need to replace starting pitchers Phil Hughes and Matsuzaka. John Lackey, acquired in a trade-deadline deal, will likely slide into the rotation. They also hope to get assistance from young hitters Mookie Betts and Carlos Correa as they plot their next return to the NLCS.
  • Fleetwood scored 19 runs in the series, but only eight in the four games they lost.
  • Metropolis has long been known for its dominant bullpen. They didn’t disappoint in this series, as they allowed only two of 13 inherited runners to score. Eight of those runners were in scoring position when the reliever took the ball. Fleetwood relievers inherited eight runners (five in scoring position) and allowed three to score.
  • Fleetwood sent 13 pinch hitters to the plate in the five games. Metropolis used just four.
  • Veteran 2B Chase Utley tried to pull the Walker offense along behind him. He hit .333/.364/.571 for a .935 OPS in his 21 at bats. Utley is a free agent for 2016 and it will be interesting to see if he makes a return to Fleetwood.

Primary Player Statistics For 2015 Metropolis Avengers Totals After 5 Games

NAME              BAVG  GM  AB   R   H 2B 3B HR RBI  BB  SO HB SH DP  SB CS  E
M.Wieters         .667   2   3   0   2  0  0  0   0   0   0  0  0  0   0  0  0
M.Cabrera         .500   1   2   0   1  0  0  0   0   0   0  0  0  0   0  0  0
M.McKenry         .500   3   4   0   2  2  0  0   1   1   0  0  0  0   0  0  0
J.Werth           .294   5  17   4   5  0  0  1   2   4   2  0  0  1   2  0  0
A.McCutchen       .278   5  18   4   5  1  0  1   2   7   4  0  0  0   0  0  0
R.Cano            .273   5  22   1   6  2  0  1   6   0   2  1  0  2   0  0  0
S.Pearce          .235   5  17   2   4  0  0  1   2   1   8  1  0  0   0  0  0
J.Bautista        .176   5  17   2   3  0  0  1   2   5   3  0  0  1   0  0  2
J.Reyes           .105   5  19   2   2  0  0  0   0   1   2  0  0  0   0  1  0
C.Iannetta        .083   4  12   2   1  0  0  1   1   1   2  0  0  0   0  0  0
P.Sandoval        .059   5  17   0   1  0  0  0   1   0   4  1  0  0   0  0  1
B.Harper          .050   5  20   0   1  0  0  0   0   1   6  0  0  1   0  0  0
G.Petit           .000   1   2   0   0  0  0  0   0   0   1  0  0  0   0  0  0
R.Rua             ----   0   0   0   0  0  0  0   0   0   0  0  0  0   0  0  0
ALL PITCHERS      ----   5   0   0   0  0  0  0   0   0   0  0  0  0   0  0  0
----------------- ---- --- --- --- --- -- -- -- --- --- --- -- -- -- --- -- --
TEAM TOTALS       .194     170      33     0     17      34     0      2     3
                         5      17      5     6      21      3     5      1

NAME               ERA  W  L   PCT   G GS CG SH SV    IP   H   R  ER HR  BB  SO
C.Kluber          0.00  0  0  ----   1  1  0  0  0   6.1   2   0   0  0   1   6
Z.Putnam          0.00  1  0 1.000   4  0  0  0  0   4.2   3   0   0  0   0   3
C.Kimbrel         1.42  0  0  ----   3  0  0  0  1   6.1   3   1   1  0   3   4
C.Carrasco        1.74  1  0 1.000   2  2  0  0  0  10.1   8   2   2  0   2  11
F.Abad            1.80  1  0 1.000   2  0  0  0  0   5.0   6   1   1  0   1   2
J.Benoit          2.45  1  0 1.000   4  0  0  0  0   7.1   5   2   2  1   2   7
A.Sanchez         4.50  0  0  ----   1  1  0  0  0   4.0   4   2   2  0   5   2
A.Chapman         6.75  0  0  ----   1  0  0  0  0   1.1   3   1   1  0   0   0
R.Choate          9.00  0  0  ----   1  0  0  0  0   1.0   2   1   1  0   0   0
C.McHugh         30.38  0  1  .000   1  1  0  0  0   2.2   7   9   9  0   4   4
N.Feliz           ----  0  0  ----   0  0  0  0  0   0.0   0   0   0  0   0   0
ALL NON-PITCHERS  ----  0  0  ----   0  0  0  0  0   0.0   0   0   0  0   0   0
Team                                          0                   +0
----------------- ---- -- -- ----- --- -- -- -- -- ----- --- --- --- -- --- ---
TEAM TOTALS       3.49     1         5     0     1        43      19     18
                        4     .800      5     0     49.0      19      1      39


Misc/Sabermetric Statistics For 2015 Metropolis Avengers Totals After 5 Games

NAME               OB%  SLUG   SB%    RC  RC/27 TOTAVG   OPS ISOPW   TB  AB/HR
J.Bautista        .364  .353  ----   2.3   4.18   .733  .717  .176    6  17.00
M.Cabrera         .500  .500  ----    .5  13.50  1.000 1.000  .000    1   ----
R.Cano            .304  .500  ----   2.4   3.67   .667  .804  .227   11  22.00
B.Harper          .095  .050  ----    .1    .08   .100  .145  .000    1   ----
C.Iannetta        .154  .333  ----    .7   1.61   .455  .487  .250    4  12.00
A.McCutchen       .480  .500  ----   5.2  10.79  1.231  .980  .222    9  18.00
M.McKenry         .600 1.000  ----   2.6  34.51  2.500 1.600  .500    4   ----
S.Pearce          .316  .412  ----   2.4   4.93   .692  .728  .176    7  17.00
G.Petit           .000  .000  ----    .0    .00   .000  .000  .000    0   ----
J.Reyes           .150  .105  .000    .2    .34   .167  .255  .000    2   ----
R.Rua             ----  ----  ----    --    ---   ----  .000  ----    0   ----
P.Sandoval        .105  .059  ----    .2    .30   .125  .164  .000    1   ----
J.Werth           .429  .471 1.000   3.8   7.98  1.077  .899  .176    8  17.00
M.Wieters         .667  .667  ----   1.3  36.00  2.000 1.333  .000    2   ----
ALL PITCHERS      ----  ----  ----    --    ---   ----  .000  ----    0   ----
---------------- ----- ----- ----- ----- ------ ------ ----- ----- ---- ------
TEAM TOTALS       .292        .667         3.13         .622         56
                        .329        16.7          .573        .135       28.33

NAME              OPPAV  H/9 BB/9 SO/9 HR/9 RNSUP  IR ISP IRS IRSC% SO/BB WHIP
F.Abad             .316 10.8  1.8  3.6  0.0   ---   1   1   1 1.000  2.00 1.40
J.Benoit           .200  6.1  2.5  8.6  1.2   ---   4   3   0  .000  3.50 0.95
C.Carrasco         .211  7.0  1.7  9.6  0.0  3.00   0   0   0  ----  5.50 0.97
A.Chapman          .375 20.3  0.0  0.0  0.0   ---   0   0   0  ----   --- 2.25
R.Choate           .500 18.0  0.0  0.0  0.0   ---   0   0   0  ----   --- 2.00
N.Feliz            ----  ---  ---  ---  ---   ---   0   0   0  ----   --- ----
C.Kimbrel          .143  4.3  4.3  5.7  0.0   ---   5   3   0  .000  1.33 0.95
C.Kluber           .095  2.8  1.4  8.5  0.0  2.00   0   0   0  ----  6.00 0.47
C.McHugh           .467 23.6 13.5 13.5  0.0  3.00   0   0   0  ----  1.00 4.13
Z.Putnam           .200  5.8  0.0  5.8  0.0   ---   3   1   1  .333   --- 0.64
A.Sanchez          .250  9.0 11.3  4.5  0.0  6.00   0   0   0  ----   .40 2.25
ALL NON-PITCHERS   ----  ---  ---  ---  ---   ---   0   0   0  ----   --- ----
----------------- ----- ---- ---- ---- ---- ----- --- --- --- ----- ----- ----
TEAM TOTALS        .236       3.3       0.2        13       2        2.17
                         7.9       7.2       3.40       8      .154       1.24


Primary Player Statistics For 2015 Fleetwood Walkers Totals After 5 Games

NAME              BAVG  GM  AB   R   H 2B 3B HR RBI  BB  SO HB SH DP  SB CS  E
D.Robertson      1.000   2   1   1   1  1  0  0   0   0   0  0  0  0   0  0  0
D.Norris          .600   4   5   1   3  0  0  0   1   2   1  0  0  1   0  0  0
M.Gonzalez        .400   5  10   2   4  0  0  0   0   1   2  0  0  0   1  0  1
C.Utley           .333   5  21   3   7  3  1  0   2   1   4  0  0  0   0  0  1
M.Cabrera         .250   5  20   2   5  2  0  0   2   1   5  1  0  0   0  0  0
J.Segura          .250   5  12   0   3  0  0  0   0   0   1  0  1  0   0  1  0
M.Trout           .250   5  20   3   5  1  1  0   2   3   7  1  0  0   0  0  0
A.Avila           .250   3   4   0   1  0  0  0   1   0   1  0  0  0   0  0  0
D.Wright          .222   5  18   0   4  1  0  0   3   2   4  0  0  2   1  1  0
F.Cervelli        .200   4  10   1   2  1  0  1   1   1   3  1  0  0   0  0  0
M.Betts           .200   5  10   1   2  0  0  0   1   2   0  0  0  0   0  0  0
D.Jennings        .182   5  11   0   2  1  1  0   1   1   1  0  0  0   0  0  0
K.Kiermaier       .158   5  19   2   3  1  0  0   3   2   4  0  0  1   1  0  0
S.Smith           .063   5  16   2   1  0  0  0   1   1   4  0  0  0   0  0  0
R.Grossman        .000   3   5   1   0  0  0  0   0   1   2  0  0  0   0  0  0
ALL PITCHERS      ----   5   0   0   0  0  0  0   0   0   0  0  0  0   0  0  0
----------------- ---- --- --- --- --- -- -- -- --- --- --- -- -- -- --- -- --
TEAM TOTALS       .236     182      43     3     18      39     1      3     2
                         5      19     11     1      18      3     4      2

NAME               ERA  W  L   PCT   G GS CG SH SV    IP   H   R  ER HR  BB  SO
J.Howell          0.00  0  0  ----   2  0  0  0  0   1.2   1   0   0  0   1   1
J.Broxton         0.00  0  0  ----   2  0  0  0  0   3.1   1   0   0  0   1   3
R.Mendez          0.00  0  0  ----   3  0  0  0  0   2.0   4   1   0  0   0   1
H.Iwakuma         1.64  0  1  .000   2  2  0  0  0  11.0   9   2   2  1   1   6
Z.Greinke         1.80  0  0  ----   1  1  0  0  0   5.0   2   1   1  1   2   3
T.Wilhelmsen      2.31  0  1  .000   4  0  0  0  0  11.2   4   4   3  1   7  12
P.Hughes          4.05  1  0 1.000   1  1  0  0  0   6.2   6   3   3  3   1   4
D.Pomeranz        4.50  0  1  .000   3  0  0  0  0   2.0   3   1   1  0   1   0
D.Matsuzaka       8.31  0  1  .000   1  1  0  0  0   4.1   1   4   4  0   5   4
A.Bastardo       27.00  0  0  ----   2  0  0  0  0   0.1   2   1   1  0   2   0
ALL NON-PITCHERS  ----  0  0  ----   0  0  0  0  0   0.0   0   0   0  0   0   0
Team                                          0                   +0
----------------- ---- -- -- ----- --- -- -- -- -- ----- --- --- --- -- --- ---
TEAM TOTALS       2.81     4         5     0     0        33      15     21
                        1     .200      5     0     48.0      17      6      34


Misc/Sabermetric Statistics For 2015 Fleetwood Walkers Totals After 5 Games

NAME               OB%  SLUG   SB%    RC  RC/27 TOTAVG   OPS ISOPW   TB  AB/HR
A.Avila           .200  .250  ----    .3   2.05   .333  .450  .000    1   ----
M.Betts           .333  .200  ----    .8   2.84   .500  .533  .000    2   ----
M.Cabrera         .304  .350  ----   2.4   4.13   .600  .654  .100    7   ----
F.Cervelli        .333  .600  ----   2.2   7.34  1.000  .933  .400    6  10.00
M.Gonzalez        .455  .400 1.000   2.2   9.78  1.000  .855  .000    4   ----
R.Grossman        .167  .000  ----    .0    .23   .200  .167  .000    0   ----
D.Jennings        .250  .455  ----   1.3   3.95   .667  .705  .273    5   ----
K.Kiermaier       .238  .211 1.000   1.0   1.52   .412  .449  .053    4   ----
D.Norris          .714  .600  ----   2.0  18.10  1.667 1.314  .000    3   ----
D.Robertson      1.000 2.000  ----   2.0    ---   ---- 3.000 1.000    2   ----
J.Segura          .250  .250  .000    .5   1.33   .300  .500  .000    3   ----
S.Smith           .118  .063  ----    .1    .27   .133  .180  .000    1   ----
M.Trout           .375  .400  ----   3.4   6.10   .800  .775  .150    8   ----
C.Utley           .364  .571  ----   4.5   8.60   .929  .935  .238   12   ----
D.Wright          .300  .278  .500    .9   1.44   .471  .578  .056    5   ----
ALL PITCHERS      ----  ----  ----    --    ---   ----  .000  ----    0   ----
---------------- ----- ----- ----- ----- ------ ------ ----- ----- ---- ------
TEAM TOTALS       .312        .600         3.68         .658         63
                        .346        20.2          .600        .110      182.00

NAME              OPPAV  H/9 BB/9 SO/9 HR/9 RNSUP  IR ISP IRS IRSC% SO/BB WHIP
A.Bastardo        1.000 54.0 54.0  0.0  0.0   ---   3   3   2  .667   .0012.00
J.Broxton          .091  2.7  2.7  8.1  0.0   ---   3   2   0  .000  3.00 0.60
Z.Greinke          .125  3.6  3.6  5.4  1.8  1.00   0   0   0  ----  1.50 0.80
J.Howell           .200  5.4  5.4  5.4  0.0   ---   0   0   0  ----  1.00 1.20
P.Hughes           .240  8.1  1.4  5.4  4.1 11.00   0   0   0  ----  4.00 1.05
H.Iwakuma          .220  7.4  0.8  4.9  0.8  1.50   0   0   0  ----  6.00 0.91
D.Matsuzaka        .077  2.1 10.4  8.3  0.0  4.00   0   0   0  ----   .80 1.38
R.Mendez           .400 18.0  0.0  4.5  0.0   ---   1   0   1 1.000   --- 2.00
D.Pomeranz         .333 13.5  4.5  0.0  0.0   ---   0   0   0  ----   .00 2.00
T.Wilhelmsen       .105  3.1  5.4  9.3  0.8   ---   1   0   0  .000  1.71 0.94
ALL NON-PITCHERS   ----  ---  ---  ---  ---   ---   0   0   0  ----   --- ----
----------------- ----- ---- ---- ---- ---- ----- --- --- --- ----- ----- ----
TEAM TOTALS        .194       3.9       1.1         8       3        1.62
                         6.2       6.4       3.80       5      .375       1.13